After setting up my new network rack I quickly realized that without fans the rack gets concernedly hot with the doors and panels closed. Since the rack is right next to my desk any fans would need to be quiet. I ended up designing a 12V PWM fan controller for the task.
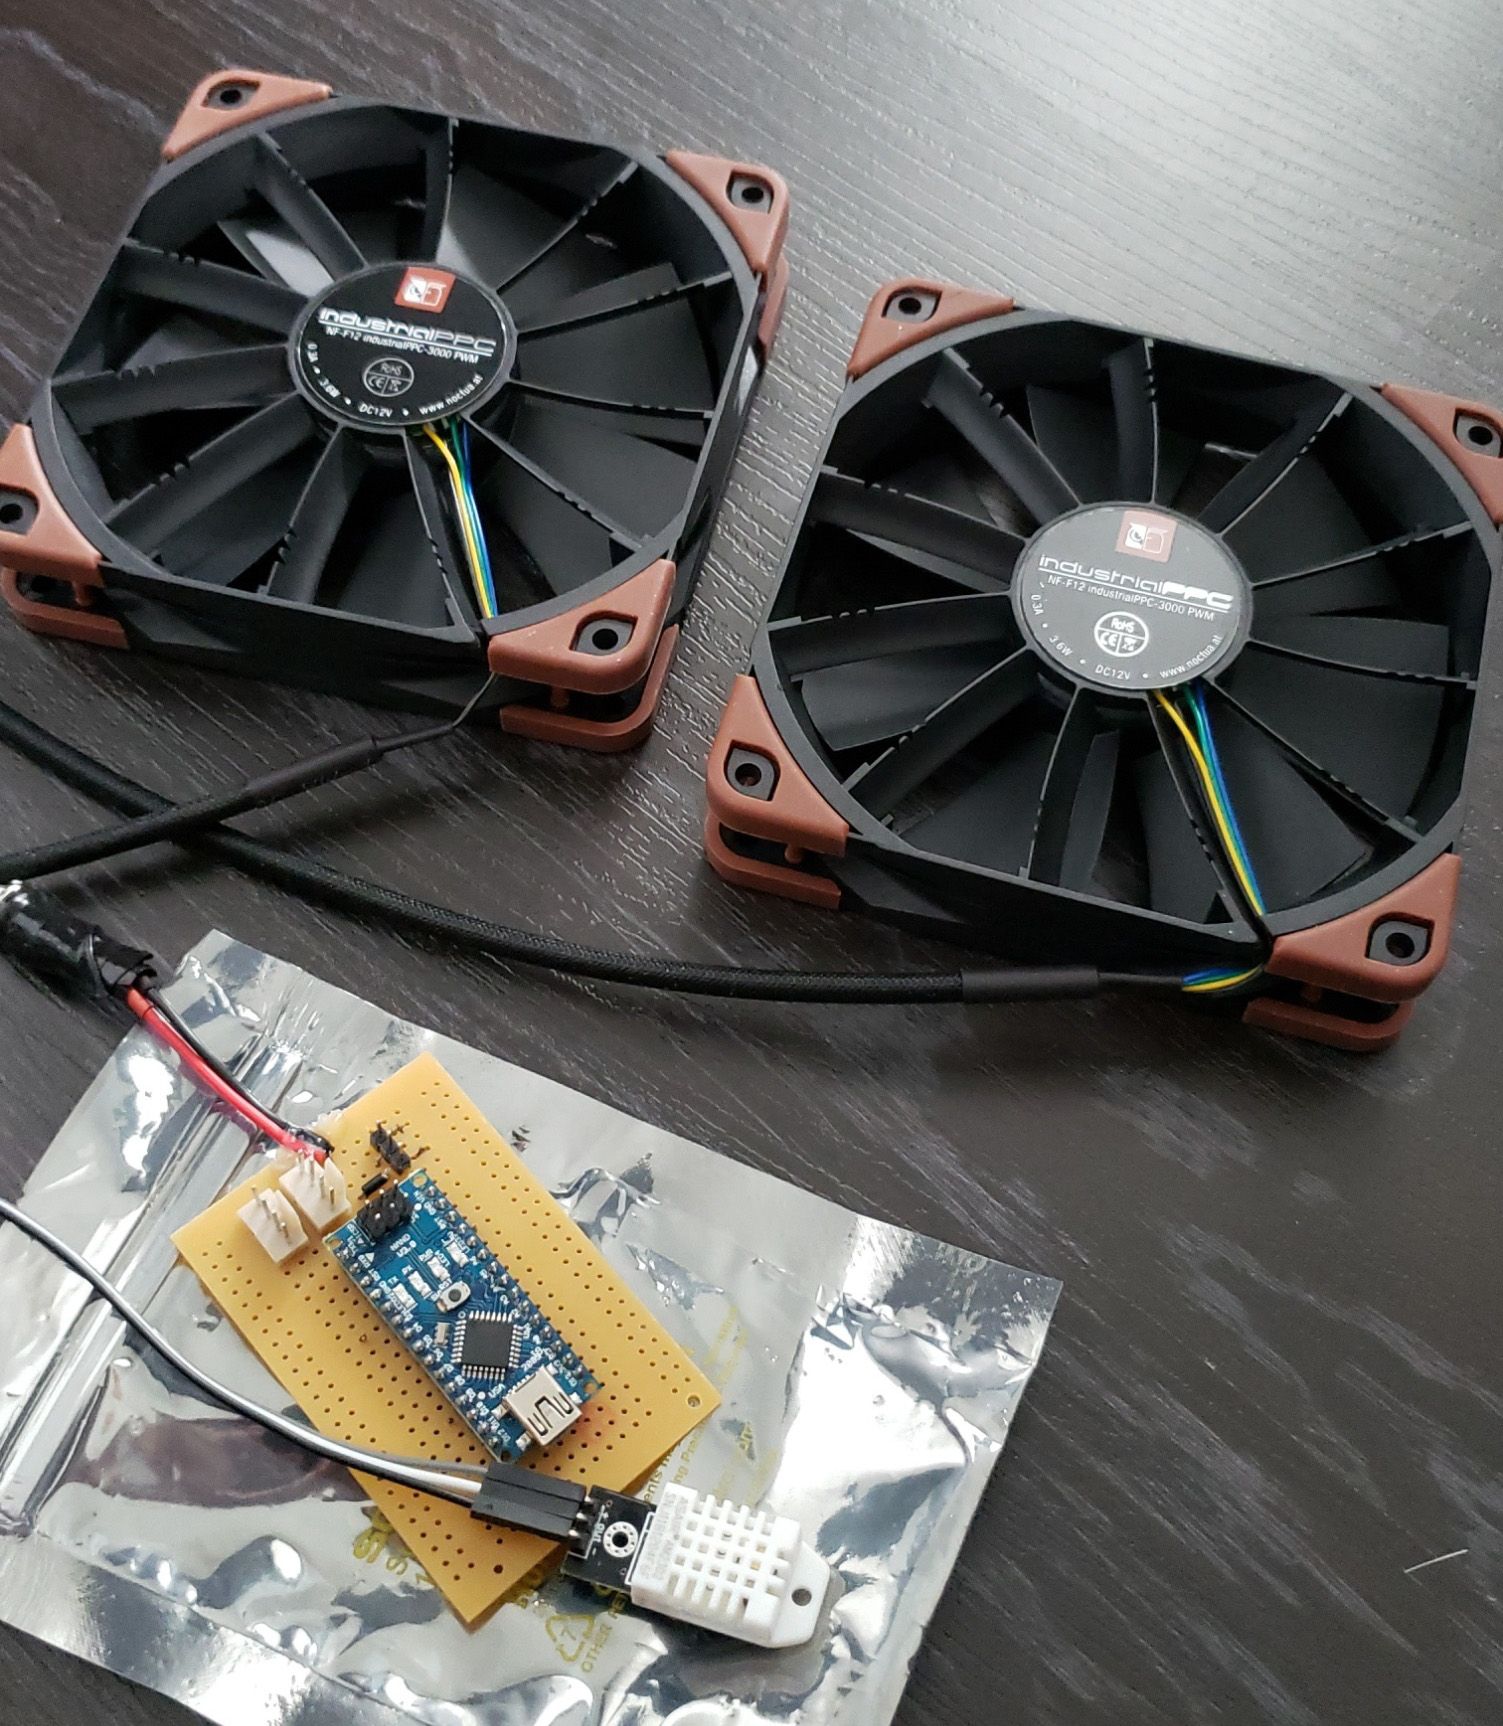
To combat this I bought two 12V 3000RPM PWM fans. I had a random 12V power supply laying around from some LED lights so 12V was done. I bought an Arduino Nano (after smoking my Uno's voltage regulator) to do the PWM and serial output.
I found a great starting point on Github for a 12V fan controller but meant for the inside of a computer: https://github.com/adolfintel/NanoFanController
I forked this repository and started working on my own version, but using a DHT22 temperature sensor: https://github.com/son1cn/NanoFanController

After getting the fan controller up and running, I decided it would be cool to get the data output from the rack temperature, PWM %, and raspberry pi temperatures together in a dashboard. This led me down quite the rabbit whole, where I ended up going with Prometheus, Node-exporter, and Grafana.
Fast forward about 2 months. A few days ago the Arduino nano just stopped responding, likely due to shorting out on something inside the rack. I had intended to make something more permanent and I suppose the nano breaking was the trigger.
With the Arduino Nano dead, I had an opportunity to upgrade to a more integrated solution that included a web server. I went with an Arduino Uno+ESP8266 board from Jaycar. This let me reuse the serial output coming out of the Arduino and I just needed to write a listener for the ESP8266 that provided a simple web response that Prometheus could consume.
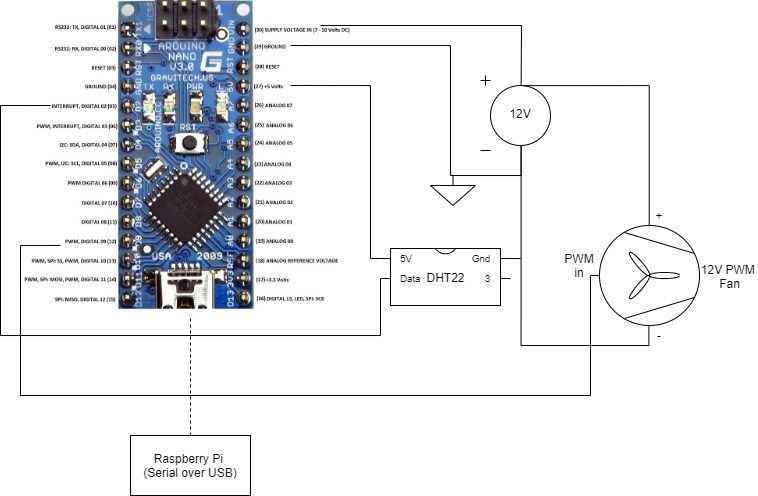
The layout of the circuit is the same, but the new integrated ESP8266 is receiving the serial output from the Arduino Uno and serving it for Prometheus to consume and serve to Grafana.

